Maintenance Fees
Peter & Adelaide Condos vs The Queen West Area


Condo
May 1, 2025
1 Year
No
Balcony
No
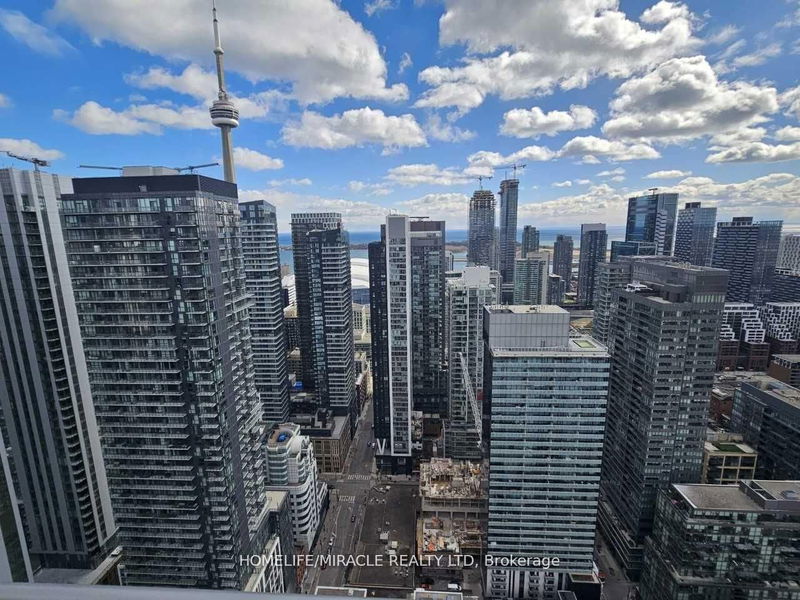
South
Owned
1 Bedroom & 1 Bathroom located at Peter and Adelaide. Unit comes with one HUGE LOCKER. Located in Toronto's Harbourfront and Entertainment Districts, Minutes from Financial and Entertainment Areas. 5 Star Quality Amenities Include 24 Hr Concierge, Outdoor Terrace, Sauna, Bar & Lounge, Party/Game Rm, Gym & More. This Location's Walk Score is 100! Walk to the Grocery store, Starbucks, Dollarama, CN Tower, TTC & Subway, Shopping, Roger Centre, Clubs, Restaurants and More!
homelife/miracle realty ltdMLS® #C12078937
Laminate, Combined with Dining, Walkout To Balcony
Laminate, Combined with Living, Open Concept
Laminate, Combined with Dining, Stainless Steel Appliances
Laminate, Sliding Doors, Window
Based on the dissemination area as defined by Statistics Canada. A dissemination area contains, on average, approximately 200 – 400 households.
| Studio | 1 Bed | 1 Bed + Den | 2 Bed | 2 Bed + Den | 3 Bed | 3 Bed + Den | |
|---|---|---|---|---|---|---|---|
| Price Range | No Data | $485,000 - $635,000 | $590,000 - $770,000 | $720,000 - $1,070,000 | $893,000 | $875,000 - $1,340,000 | No Data |
| Avg. Cost Per Sqft | No Data | $1,171 | $1,189 | $1,142 | $1,298 | $1,138 | No Data |
| Price Range | $1,995 | $1,500 - $2,700 | $2,295 - $3,200 | $1,380 - $3,500 | $3,100 - $3,700 | $1,350 - $5,450 | No Data |
| Avg. Wait for Unit Availability | No Data | 53 Days | 48 Days | 42 Days | No Data | 87 Days | No Data |
| Avg. Wait for Unit Availability | 166 Days | 6 Days | 4 Days | 4 Days | 17 Days | 12 Days | No Data |
| Ratio of Units in Building | 1% | 18% | 32% | 30% | 7% | 9% | 1% |
Total number of units listed and leased in Queen West
